
Brickfield Enable: Analysis dashboard
Table of Contents
Introduction
The analysis dashboard has two sections, “Course categories” and “Courses”.
- The “Course categories” section provides the ability to filter by category and course to find the specific category or course you want analysed.
- The “Courses” section lists the courses for that category broken down by not requested, requested, in progress, and completed.
N.B.: In the top right of the Analysis dashboard is a “Help docs” button that will bring your directly to this documentation page.
Viewing the Analysis dashboard
Access to the Analysis dashboard is controlled by capabilities as outlined below and can be accessed via:
- From Site administration: Site administration > Brickfield Enable > Accessibility management > Analysis scheduling
- From a course: Course actions menu > More > Brickfield Accessibility+ Toolkit > Admin > Analysis
- From the course block: Accessibility+ Review block > View Accessibility+ report (Chart icon) > Admin > Analysis
How to use the Analysis dashboard
The course categories section can be used to view a breakdown of the number of courses that have been analysed in a category and to filter the courses section by category or a specific course. In large categories, this helps you efficiently find the relevant course for analysis.
The courses section, lists courses for the currently selected category grouped by not requested, requested, in progress, and completed. You can then select all courses on the current page, or all courses in the chosen category, and submit them for the chosen action. For more details on the available actions for each stage, please see the “Courses section” below.
Course categories section
The “Course categories” section provides the ability to view a breakdown of the category and further filter by course if needed.
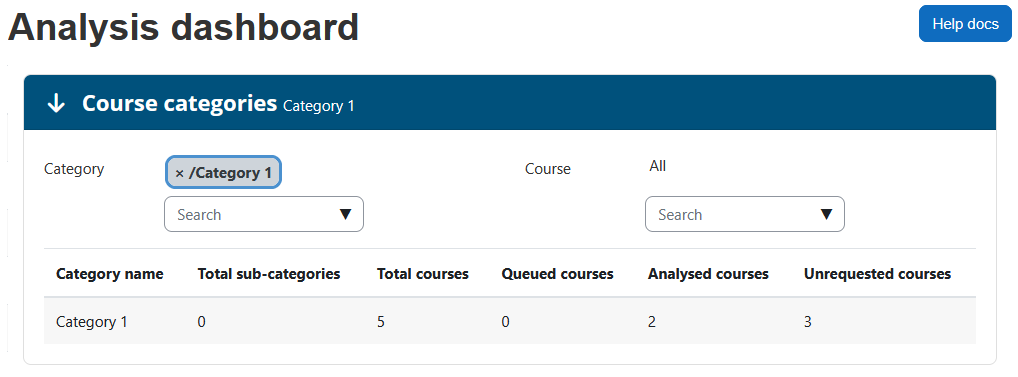
The category breakdown table displays the following:
- Category name: the category name.
- Total sub-categories: total number of sub-categories.
- Total courses: total number of courses the category contains.
- Queued courses: current number of courses that are in queue to be analysed.
- Analysed courses: total number of analysed courses within the category.
- Unrequested courses: number of unrequested courses the category contains.
Courses section
The “Courses” section provides the ability to choose all or a selection of courses to analyse in the selected category in the “Course categories” section.
Below the table is a dropdown that contains actions that you can select and submit courses for.
- On the Not requested tab, the actions are “Request analysis”.
- On the Requested tab, the actions are “Remove from queue” and “Give priority in queue”.
- On the Completed tab, the actions are “Request re-analysis” and “Remove analysis”.
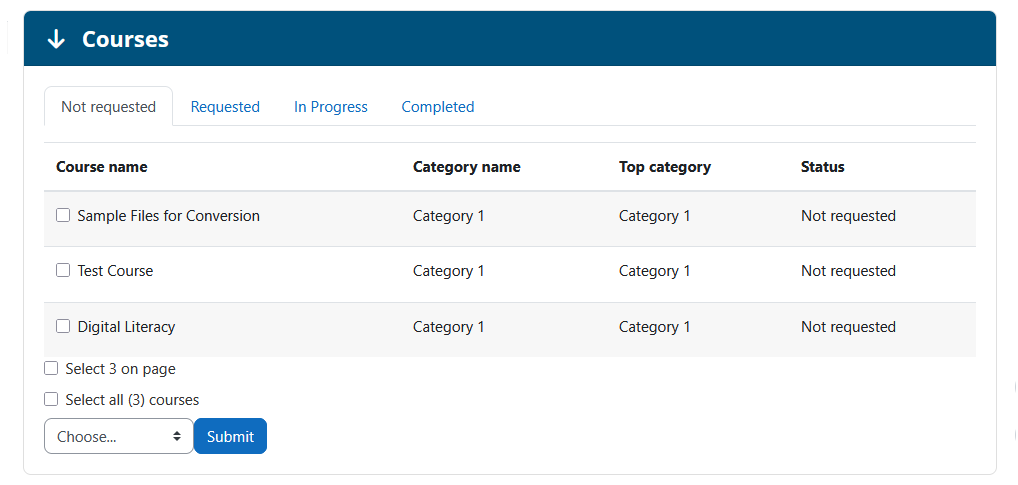
The “Not requested” table displays the following for each course:
- Course name: course short name.
- Category name: parent category name
- Top category: top level category name.
- Status: Not requested.
The “Requested” table displays the following for each course:
- Course name: course short name.
- Category name: parent category name
- Top category: top level category name.
- Status: Requested.
The “Completed” table displays the following for each course:
- Course name: course short name.
- Category name: parent category name.
- Top category: top level category name.
- Status: Completed.
- Date analysed:
Capability Requirements
Access to the Accessibility+ Toolkit is controlled by capabilities and users must have the correct capabilities in the correct context.
- ‘tool/bfplus:viewsystemtools’ capability – To view site level reports and wizards.
- ‘tool/bfplus:viewcoursetools’ capability – To view individual course reports and wizards.
- ‘accessibilityplustool/analysismanagement:view’ capability – To view this analysis dashboard, users must have this and one of the capabilities mentioned above.
For more information, see: Capabilities.