Marking guide: Teacher
Report overview
To access this Marking guide grade report:
- Go to a course.
- Click the Grades tab.
- Click the Gradebook navigation menu.
- Select the Marking guide report option.
- Select the relevant activity for viewing results.
- This covers both assignments and forums.
The Marking guide report page displays:
- Filters – The Marking guide report filter options.
- The relevant activity on which to view results.
- Display – The Marking guide report display options.
- Display remarks. (Default is on).
- Display summary. (Default is on).
- Display email. (Default is off).
- Display ID number. (Default is off).
- Rubrics – The Marking guide table, with the main results content.
- Download formats – The links to download the table data.
- CSV.
- Excel.
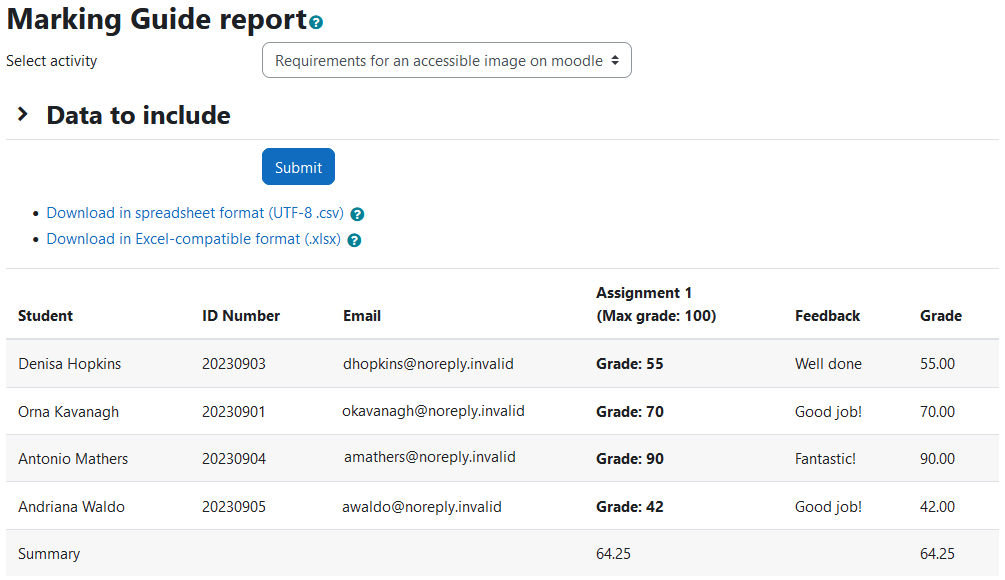
The display options are viewable under the form heading “Data to include”, which is toggleable for expanding and collapsing.
To make any activity selection or display option changes:
- Select the new activity in the dropdown.
- Tick or untick any of the display options as needed.
- Click on the “Submit” button.
- The table results will now be refreshed with these changes.
The Marking guide report table displays the following details for each user:
- Student – student name.
- ID Number – student ID number (optional).
- Email – student email (optional).
- Per criterion configured (normally multiple ones):
- (Header: Criterion name and maximum grade possible.)
- Grade.
- Criterion feedback comment.
- Feedback – the overall feedback received (for assignments only).
- Grade – the overall grade received.
- Download these results in CSV or Excel format.
- A summary row at the end of the table shows the combined results of all users.
- This can be removed from view in the display options.