View a variety of data charts and data tables for your course’s user engagement activity, based on the Moodle site logs, to anticipate and manage busy periods.
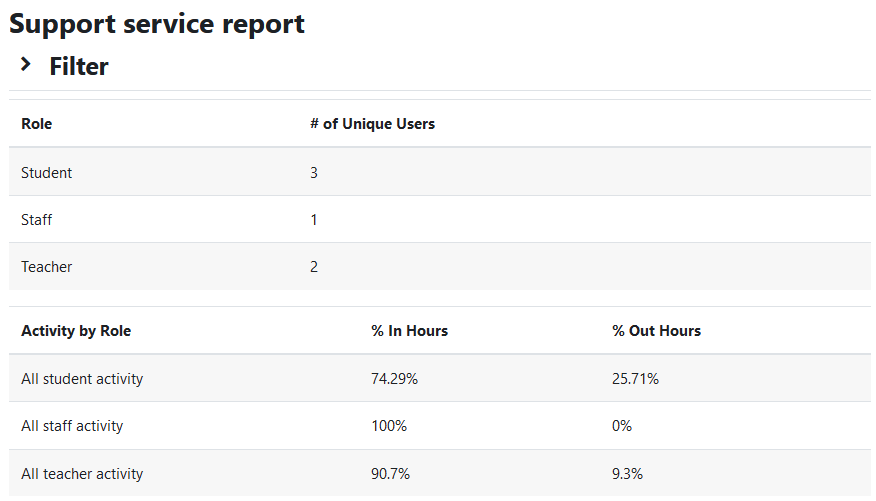
Roles, and unique user totals.
Roles’ engagement, split by In Hours and Out of Hours.
Percentages.
Engagement totals.
Overall engagement, split by days of the week.
Filter your results based on time, all resources or specific ones, and all roles or specific ones.