Course Tag Timeline: Teacher
Report overview
To access this Course Tag Timeline report:
- Go to a course.
- Click the Reports tab.
- Click the Multi-tag Timeline report link.
This Course Tag Timeline report page displays:
- Filters – The Multi-tag Timeline report filters.
- Tags: Each course tag is displayed separately, and can be toggled on and off.
- Tasks: Each task, or activity, is displayed separately, and can be toggled on and off.
- Time display – The Multi-tag Timeline report time display options.
- Week view
- Day view
- Display breakdown – The Multi-tag Timeline breakdown options.
- Chart
- Table
- Multi-tag Timeline – The Multi-tag Timeline chart or table, with main content results.
- Download formats – The links to download the table data.
- CSV.
- Excel.
The time display options are viewable to the right of the tabs as a dropdown menu.
To make any tags or tasks selection or display option changes:
- Toggle on or off any of the tags or tasks as needed.
- Select either the “Week view” or “Day view” as needed.
- The table results will be refreshed with these changes.
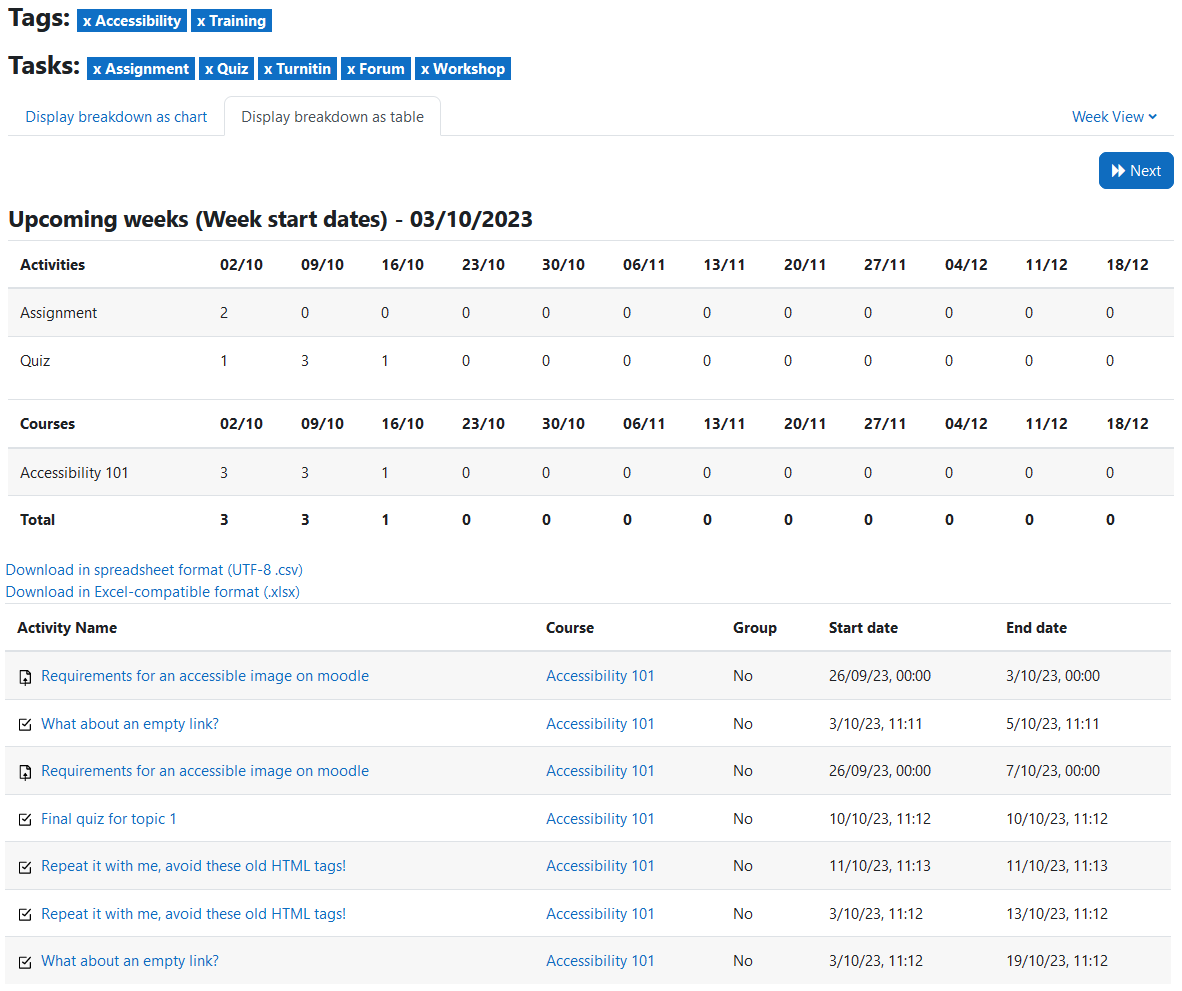
The multi-tag timeline table view has three sections:
- Activities: a summary per activity type: assignment, quiz, and so on.
- Courses: a summary per course.
- Listings of individual activities.
The activity type summary shows the amount of assignment instances, quiz instances, and so on, per time period.
The courses summary shows the amount of all instances,per course, per time period.
The listings of individual activities displays the following details for each activity:
- Activity name
- Course – course full name
- Group – yes or no for group mode being enabled.
- Start date
- End date